House Price Growth Index
Zoopla UK Cities House Price Growth Index shows the buyers attitude in the housing market.
Main Features
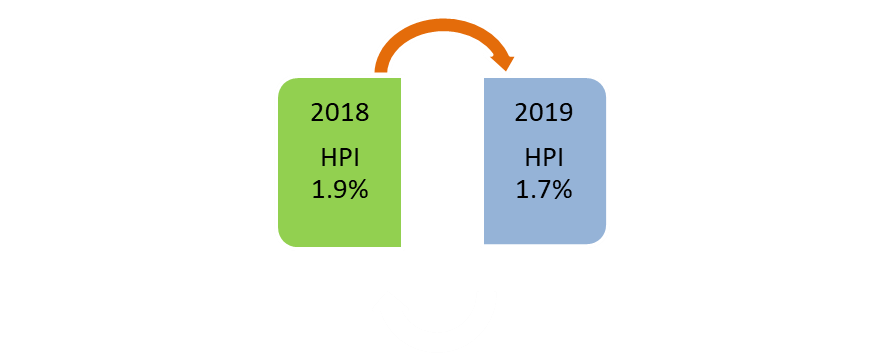
- House price inflation in the UK stands at 1.7% as per the Zoopla Hometrack analysis
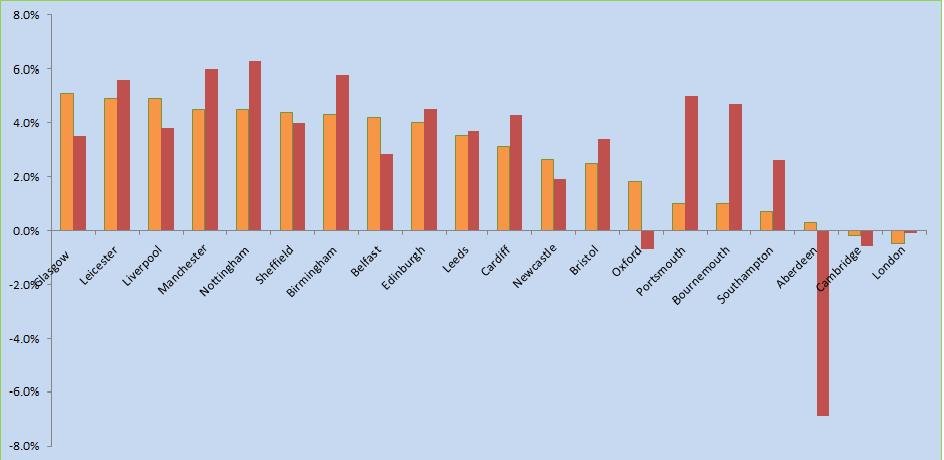
- Glasgow grew highest at +5.1% whereas prices in London registered negative growth -0.5% over the last 12 months

House Price Growth Index
- Discounts to asking price increased in 2019 Q1 across nearly all cities. With the exception of Leicester, these discounts are increasing off a relatively low base and indicate that buyers are not prepared to keep pace with asking price growth

House price growth weakens across southern England
UK city house price growth is running at +1.7% down slightly which was on the level of 1.9% one year ago. There are variations in price growth between cities with annual growth ranges from a high of 5.1% in Glasgow to -0.5% in London. The smallest spread in annual growth recorded across the 20 cities since 1996.
| Month | 3-month change | % YoY | Average Price |
| 18-Nov | -0.40% | 1.20% | £251,100 |
| 18-Dec | -0.30% | 1.20% | £251,300 |
| 19-Jan | -0.10% | 0.90% | £251,200 |
| 19-Feb | 0.40% | 0.90% | £252,100 |
| 19-Mar | 1.00% | 1.10% | £253,800 |
| 19-Apr | 1.80% | 1.70% | £255,600 |
The fastest-growing city has the slowest growth since 2012
London was the fastest growing city in 2014 where house prices were growing at an annual rate of 18%. The growth rate grew further 3 years ago due to the rising demand and Stamp Duty changes in April 2016. Since then, the rate of price growth has slowed to 5.1%. The last time the fastest-growing city was at this level was in London seven years ago, at the end of 2012, just as the house price growth started to accelerate
The pace of growth weakens across southern cities
Looking across the 20 cities, house price growth is higher than a year ago in eight cities. The deceleration in price growth has been most marked in southern England with Bristol, Portsmouth, Bournemouth and Southampton all registering price inflation at or below 2.5%.
Discounts still increasing in London
In London, the average discount from the asking price has increased from just 1% in 2016 to 4.8% over 2018 and 5.7% today. Price falls have been concentrated in inner London areas where discounts are largest and average of 7.6%. Buyers in most central areas continue to obtain double-digit discounts. In outer London and the commuter areas, discounts average 5.1%.
House price growth tracks earnings in the long term
Price growth continues to moderate with the slowdown now extending beyond southern England. House prices have displayed 5-7 years of strong house price inflation comparative to the growth in average incomes.
Lower mortgage rates supported increased buying power and higher prices, but the impact is weakening with mortgage rates having bottomed out two years ago at c.1.5% and new mortgage regulations limiting the ability of households to push affordability.
Price adjustment
Once lower mortgage rates are fully priced into the housing market then house price growth should track the growth in earnings long term hence the recent convergence in city house price growth. In the short term, it is expected that the price adjustment in London shall continue although sales volumes are expected to tick upwards.
The slowdown in the rate of growth will extend further across the south of England while continued above-average house price growth is expected in regional cities where employment levels continue to grow, and affordability is attractive.