
Brexit Referendum 2016 – Effect on the Investment in Housing Market UK
Effect of Brexit Referendum on the Investment in Housing Market UK
The Brexit Referendum was announced on February 22, 2016. Not only the actual referendum results but also the announcement caused severe impacts on the economy of the UK. The Brexit Referendum results were unforeseen and pushed the UK economy towards uncertainty. The housing market UK is a vital component of foreign and local investment affected significantly by the Brexit Referendum (PwC, 2016). The study is an analysis of housing prices paid between 2014 to 2017. The average price is high and similar in 2017 across all selected cities for the analysis. Yet, overall property price paid transactions declined sharply after the Brexit announcement. Analysis of the data proposes lower investment in low-price houses that might have been affected by the perceived lower demand for such houses in the future. I have limited my analysis until 2017 to eliminate the impact of the Covid pandemic from it. I firmly believe that the Brexit referendum, along with many other economic factors, has negatively affected housing prices.
Table of Content
- INTRODUCTION. 1
- RESEARCH QUESTION. 2
- DATA DESCRIPTION 3
- DATA CLEANING AND METHODS. 4
- RESULTS AND ANALYSIS. 5
- DISCUSSION. 8
- CONCLUSION 9
- REFERENCES. 10
Introduction
The housing market UK has constantly been experiencing soaring prices since 1995 except few short-term declines. However, investment in housing is significantly subtle and influenced by sudden changes in the laws and future perceptions. European migrants were instrumental in keeping the housing demands to a higher side, and migration is the vital factor behind the value appreciation of tiny houses in main UK cities. Decreased demand for houses leads to low mortgage growth. House prices are vulnerable to the new immigration laws and policies. For instance, household income was expected to fall 1.3 to 2.6 per cent
after Brexit, making up £850 to £1,700 per household per year in monetary terms ( Dhingra, Ottaviano, Sampson and Reenen, 2016). Hence, it requires the attention of the
The government not only from an investment perspective but also on a societal level (Ansell and Adler, 2019).
The study attempts to find the effects of the Brexit vote on the housing prices of the UK’s six cities: London, Manchester, Birmingham, Leeds, and Bradford. A sample of five main cities is selected from the data for the simplicity of the analysis, which can be categorised between London and outer London. Prices in London are higher compared to other cities, primarily owing to more business opportunities. The demand for houses is higher in London specifically and outer London in general. Higher demand and investment protection attract international investors to invest in safe markets. (Yi Wu and Nicole Lux, 2018). Figure 1 shows the voting trends of the referendum in the sample cities selected for the analysis:
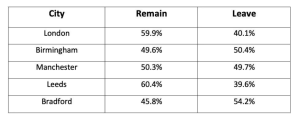
Figure 1: Voting Trends in Sample Cities
Research Question
Analysis of census 2011 indicates that Europeans share of migrants in the rented sector is higher. EU nationals account for almost 60 per cent of private tenants in the UK Census approves that new migrants are renting more houses in the UK. Therefore, there is a high possibility the change in migration laws would affect the housing market UK. Thus, this analysis will answer the question did the Brexit Referendum cause a decline in investment in the housing market in major cities of the UK?
Data Description
Data for the analysis is obtained from the Government of UK data.gov.uk. The Price Paid Data includes information on all registered property sales in England and Wales traded for entire market worth. Address details have been shortened to the town/city level. A single data CSV file is available for the year from 1995 to June 2017. I have ignored yearly files available for 2018 to 2020 and monthly files for 2021 to eliminate the impact of COVID from my analysis.
It is pertinent to mention that the above categories describe property type, whereas bungalows are not identified separately. Moreover, end-of-terrace have not been categorised separately and are included in the Terraced category.
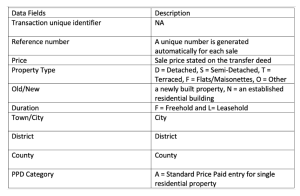
Figure 2: Data Description
Data Cleaning and Methods
House Prices Paid data file is accessible at data.gov.uk for all the districts of the UK CSV file size is 2.4 GB, incorporates the years from 1995 till June 2017. There is also a separate data file for the entire year of 2017. The file used includes the full year data of 2017 in the original file. Moreover, four years of data were sufficient to analyse the influence of the Brexit referendum. Therefore, the data were cleaned up on the google club by taking the following steps:
First Step
First, two unwanted columns were dropped from the file: “Transaction Unique identifier” and “Reference number.” Secondly, unwanted years were eliminated to get the file from 2014 till Mid 2017.
Second Step
The transaction date column contained information regarding the date and time which was unnecessary for the analysis. Therefore, years were extracted from the date column to obtain the number of transactions.
Third Step
All other cities were removed from the file except London, Birmingham, Leeds, Bradford, and Manchester. A final CSV file was obtained from Google Colab for further visualisation. 2017 data file was cleaned separately through the same steps explained above and included in the final CSV that gave complete data for the years from 2014 to 2017.
Fourth Step
Before visualisation, transaction counts were obtained through google Colab. Transaction counts showing several Birmingham, Leeds, Manchester, and Bradford transactions each year are summed up in the following Graph.
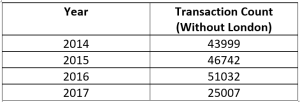
Figure 3: Transaction Counts with London Excluded
Figure 4 shows the total number of counts with the data of the city of London included. The table depicts the magnitude of transactions performed in London alone. From the comparison of these two tables, it is clear that the pattern of counts in cities without London and with London are almost identical.
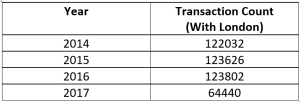
Figure 4: Transaction Counts with London Excluded
Although various visualisation techniques were used to see trends in data, I have used pie charts on Minitab and line charts on Google Colab to present the final analysis. Bar charts, relplots and pairplots were used to visualise the data and its trend in depth but were not presented in the analysis to keep it convenient and uncomplicated.
Results and Analysis
As The data set at hand is simple and easily comprehend able, various simple visualisation techniques efficiently served the purpose. For better analysis, the original data is broken into two parts. In the first part, London is included with other sample cities, whereas in the second part, London is taken out to measure the effect of Brexit on outer London. The reason for separating London was the magnitude of international investment primarily focused on London. Pie charts have been used to visualise the market share of selected cities in terms of prices paid for properties, the number of transactions for property sale, share of the types of properties and their age. Figure 5 shows the types of properties sold the most. Share of Flats in the sold property market is higher.
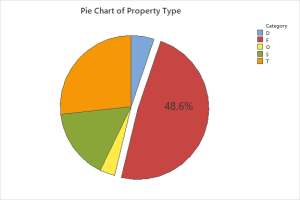
Figure 5: Share of Property Type
The pie chart in Figure 6 shows properties sold in different years in all selected cities. Transactions in 2017 have dropped to half compared to other cities.
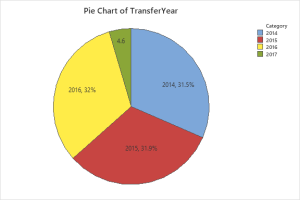
Figure 6: Transaction Per Year
Market share of each selected city. London’s most significant share is because of the interest of international investors, and flats are more likely to attract this investment than houses. It is worth noting the magnitude of investment in Leeds. Leed’s share of 9.6 per cent among the selected cities is encouraging, and future perspectives investing in Leeds are brighter.
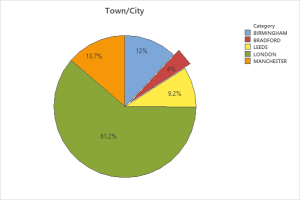
Figure 7: Share of Property Type
Figure-8 shows the trend of the prices paid in London, Birmingham, Manchester, Leeds and Bradford. The trend showed an upward trend in prices in 2017. It is essential to note that the trend in Figure 8 portrays average prices despite decreased sales transactions related to properties in 2017.
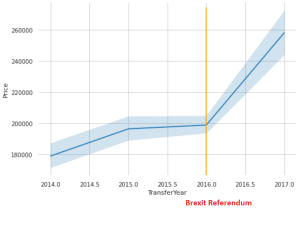
Figure 8: Selected Cities Price Comparison with Years
Figure-9 shows a trend that shows a decline in overall sales transactions in the housing market UK after Brexit Referendum. Actual transactions have been separately provided in Figure 3 and Figure 4
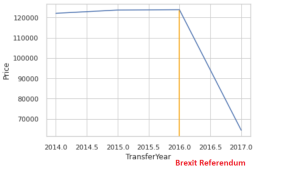
Figure 9: Yearly Transactions in Selected Cities
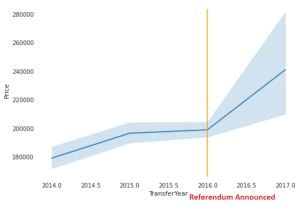
Figure 10 shows average prices in all cities except London. As London skews the data toward high prices, Figure 10 gives a fair view of prices outside of London.
Figure 10: Yearly Transactions in Selected Cities with London Excluded
Discussion
The Brexit has affected the UK economy significantly at various levels, especially the housing market UK, which profited from the pre–Brexit European migration. John Perry and Peter Williams (2017) predicted downward trends in the buying patterns of the housing market, including both transactions and prices, after the Brexit referendum. RICS residential market survey intimated slow growth in price and minimum new instructions (RICS, 2016). An initial market evaluation by PWC11 claimed that the Brexit referendum would harm house-price inflation, which will plunge from a projected 3.1 per cent in 2016 to 0.9 per cent in 2017 (UK Economic Outlook, 2016, p.17). Bank of England also predicted a decline in house purchase lending.
Our results of the analysis of five sample cities, namely London, Birmingham, Manchester, Leeds and Bradford, confirm the negative impact on the total transaction related to sales of properties in the UK after the Brexit Referendum, which is evident from the Figure-9. If we read figure-9 with Figures 3 and 4, this will give us an unbiased view of the decline in property sale transactions and its related trend.
Figure 8 shows an upward trend in prices. The rise in average prices is due to the decline in in- vestment in a small housing units. Before the Brexit vote, the movement of European migrants to the UK was higher than in other nationalities. Moreover, most of the European migrants were buying or renting small housing units (John Perry and Peter Williams, 2017). The analysis confirms the decline in small housing units with low prices. When investment in low price houses declined, the average price rose. Resultantly, small investments were pulled out of the market. Significant and international investments primarily focus on high price units and stable markets. Such investments were less affected by the Brexit referendum. The high-price unit transactions in 2017 and the absence of low-price units skewed the data towards average price rise. However, actual investment decreased after the Brexit referendum.
London’s effect on the overall analysis is apparent in Figure 8. Therefore, it was essential to know the effect of the Brexit referendum on all other cities without London in it. The trend in Figure 10 shows the average price rise in sample cities without London for the same reasons. However, the average price in these cities is still far lower.
It is pertinent to mention that the investment in housing in a particular area was a key factor behind the Brexit referendum vote. Therefore, a higher concentration of investment in the housing market UK played a part in shaping the support for Brexit (Alder and Ansell, 2019). Figure-1 shows the percentage of remain or leave vote results of the Brexit referendum where Leeds voted against Brexit with a high percentage compared to other selected cities. Leeds has been a destination for many European immigrants. From the analysis results, we may conclude that Leeds is showing an encouraging trend as an emerging market for housing investment.
Conclusion
The analysis finds a trend in the investment in the housing market UK after the Brexit referendum. The results confirm a decline in investment in the housing market. However, the average price rise after the referendum validates reduced investment in small housing units, skewed the data towards high price units. The reason behind this might be a perceived less demand in the property rental sector due to the foreseen curbs on European migration. However, a reduction in overall sale transactions in 2017 confirms a decline in overall investment after Brexit Referendum.
The analysis allows exploring supply and demand trends in the housing rental sector in the context of the changes in migration laws such as Brexit. Various businesses can find the result helpful in devising a strategy to lure idle investment abandoned by small to medium investment in purchasing small housing units. We can further explore the gap between the supply and demand of houses for rent and sale, explicitly focusing on the trends of rents and prices associated with small housing units. Further studies will help the government act proactively and devise a plan to minimise the risk of lost investment in the housing sector. This may boost the economy and help keep houses affordable for the masses.
References
UK Economic Outlook, July 2016. www.pcw.co.uk/Economics.
Ben Ansell, 2017. Housing, Credit and Brexit, University of Wisconsin, Madison. Government of UK, 2016, EU referendum, www.gov.uk.
HM Land Registry, 2020, Price Paid Data, data.gov.uk.
RICS, 2016. Real estate management 3rd edition, www.rics.org.
Swati Dhingra, Gianmarco Ottaviano, Thomas Sampson and John Van Reenen, 2016. The consequences of Brexit for UK trade and living standards, Center for Economic Performance, London School of Economics and Political Science.
- Ansell and D. Adler, ‘Brexit and the Politics of Housing in Britain’, in G Kelly and N Pearce (eds.), Britain Beyond Brexit, The Political Quarterly, Vol 90, Issue S2, 2019, pp. 105–116. https://doi.org/10.
David Adler and Ben Ansell (2020) Housing and populism, West European Politics, 43:2, 344-365, DOI:10.1080/01402382.2019.1615322
John Perry and Peter Williams, 2016. A waiting game: how Brexit might affect the housing market, supply and demand, Chapter:1, Section:1, Contemporary Issues.
Yi Wu and Nicole Lux, 2018. UK House Prices: Bubbles or Market Efficiency?Evidence from Regional AnalysisCass Business School, City University of London, London EC1Y 8TZ, UK; [email protected]